Friday 29 October 2010

The market is walking on a very fine line......possible NYSE count - PART II

Going into the FED meeting and QEII announcement, TMN expects two possible outcomes: (1) markets open down on Monday, with NYSE continuing its wave 3 down to around 7220; (2) NYSE moves upwards to a new high labelled as (E).

                              click on chart to enlarge

So far, we had a failed inverse HnS pattern (green colour) and this should normally take the market to the opposite direction (remember the failed HnS pattern failure of summer 2009?).

The bullish count until 03/11 is labelled with the black ABCDE, whereas the bearish count is labelled as the blue 1-2-3. 

TMN for the time being remains with the bearish count.

The market is walking on a very fine line......possible NYSE count

The markets are definitely looking a bit tired with different internals pointing to the downside.
A possible bearish count still in the cards is that of NYSE which can be seen in the chart below.
An alternative bullish count would be to label [2] as (1) of wave [3] up; but for the time being TMN will stick to the bearish one.
Since the July rally, divergences can be found in NYMO and TICK; the percentage of stocks above the 50MA has been in overbought territory for some time and  is now looking downwards; and finally, the volume indicator is going nowhere for the last couple of sessions and has printed its high at the beginning of October.
Certainly, the next trading sessions are going to be extremely important.....

                        click on chart to enlarge

Wednesday 27 October 2010

TMN Roundup on SPX, TYX and USD

As TMN has pointed out various times over the last 10 days, we are in the middle of a top building process in SPX. Tops are tedious procedures and sometimes seem to be taking forever. The short term trigger SPX (cash) 1171.5 has been hit today which suggests that a test of the mid Bollinger Bands (today @ 1168.87) on the daily charts is not far off. In an ideal world we will want to see a few closes below this level and head lower from there. 

         please click on chart to enlarge


TYX is advancing as expected and has now cleared the area around the 38% fib level between the April 2010 top and the recent low. There is a small chance for a short term pull back, we will have to wait and see, could be noise..


         please click on chart to enlarge


The USD is helping the case for both of the above mentioned views, as it is on the upward path today. TMN mentioned last Sunday that the DXY set up on the weekly charts was the strongest in years and this week we are getting a flavour of how this might play out. For a change TMN is posting the USD related ETF (Ticker UUP).


       please click on chart to enlarge


Tuesday 26 October 2010

"No Risk - No Fun" - back in play?

Junk Bonds have had a massive comeback over the last, eeeeerr, yes ever since the FED started injecting liquidity! A lot of issues went from 20-30 cents back to or at least close to par. What a miraculous recovery that has been...


                     click on the chart to enlarge

Rightly John Hussman is pointing out this week that Bernanke is leaping into the liquidity trap . Because the theoretical godfather himself knew:


"There is the possibility... that after the rate of interest has fallen to a certain level, liquidity preference is virtually absolute in the sense that almost everyone prefers cash to holding a debt at so low a rate of interest. In this event, the monetary authority would have lost effective control."
John Maynard Keynes, The General Theory

Well, for now markets tell us that it is still a bit of a way towards this situation but  thanks to the FED's fight fire with more fire approach to the debt issue TMN is certain we are headed this way if these guys do not get stopped either by the people or the government bond market. I mean, let's face it, risk premia are on the way to disappear again, as effectively there is no risk in holding a debt instrument.

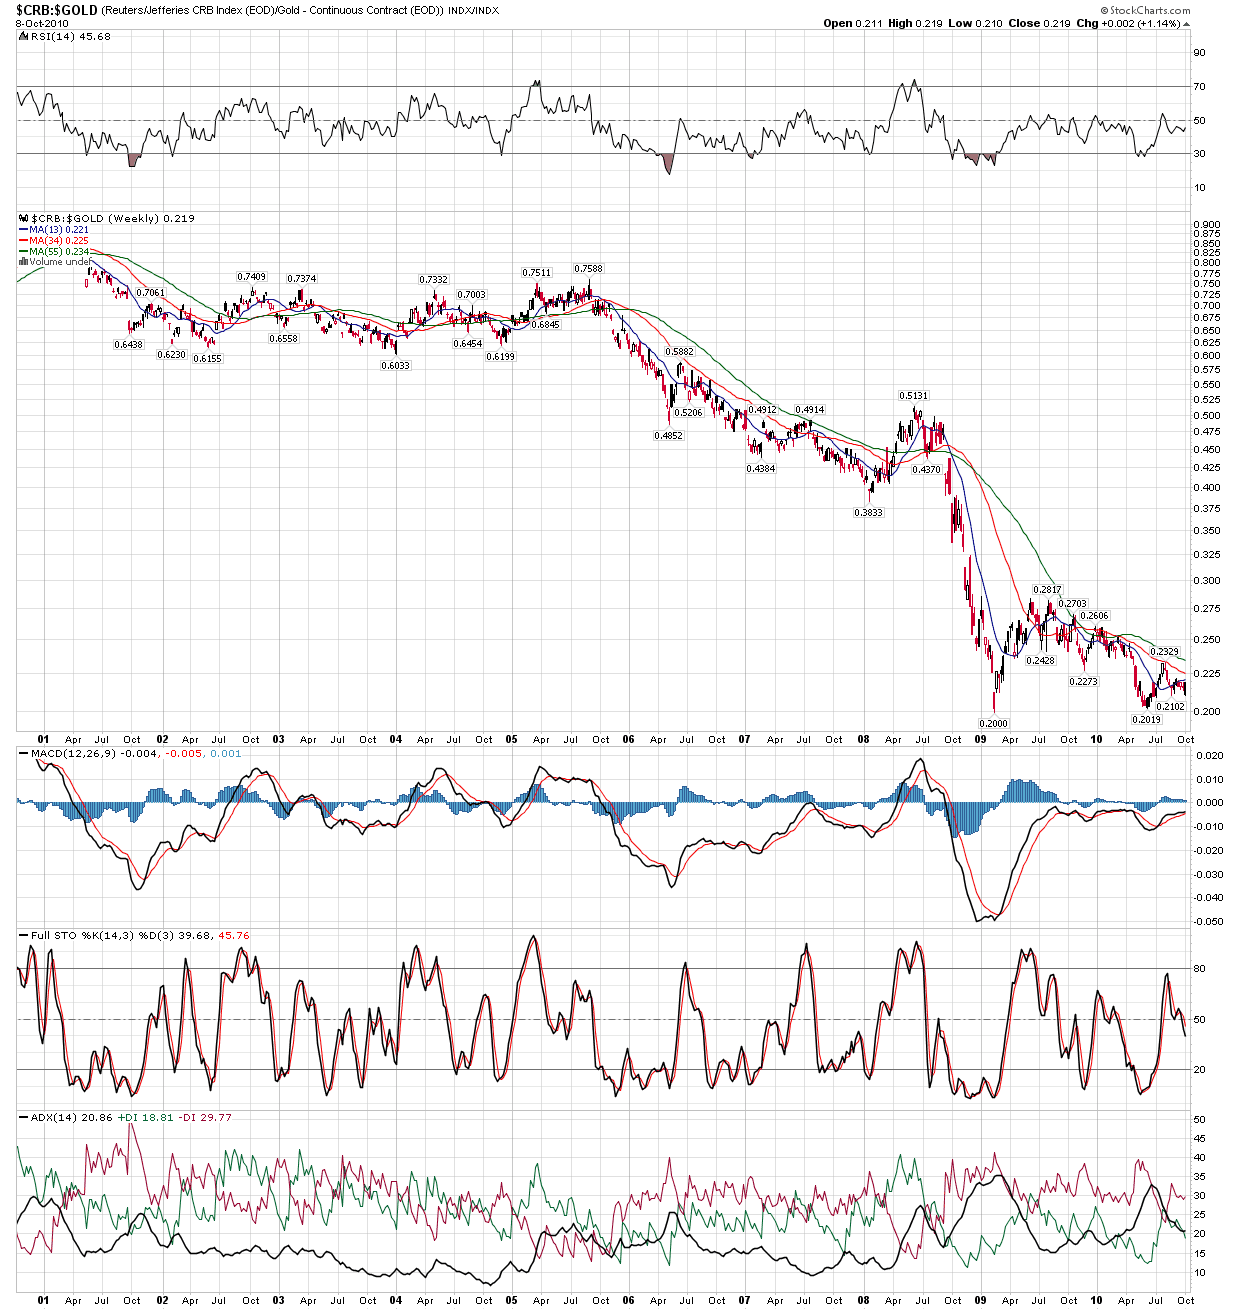
As there seems to be no risk, but also no yield any more, TMN's natural thought must be: why bother with all this if there is no risk, no fun and potentially a big headache involved. Is this what the chart below is telling us? 

           click on the chart to enlarge

Unfortunately this is only yesterday's chart, however, today this ratio is about 2% down on the day. Please note that more often than not, when this ratio trades lower, there is a heavy deflationary sell off across asset classes happening at some point. Whereas, when you see this ratio headed higher chances are that not only government bonds are outperforming the USD but many other asset classes, too. 


The turn higher from June 2010 has got to go down in history as the period where even the dead had one last dance. TMN was not a market participant in 1987 but people that have been claim that one could have bought anything and it would have made money back then. Rings a bell?


 Anyhow, this chart now is suggesting that there is a chance  market participants are swapping "hope" for cash.  Precious metals seem to be getting some attention on the back of this (why bother with any paper??), as both Gold and Silver are up today but it could be a matter of time until also these two fall victim to short term liquidity needs. TMN would not short them outright, will stay short bonds though until further notice instead.


Monday 25 October 2010

The good, the bad and the ugly story of the tanker market

Second-hand tanker values continue to remain strong, despite the spot market enduring one of the longest periods of poor earnings in decades. 

Vessels continue to change hands and some companies/owners are still willing to pay high prices, even though daily earnings for most tanker companies are well below operating costs. For example,  a modern five-year-old aframax has actually increased in value over the last three months and has now reached $47million. On the other hand, aframax time charter equivalent earnings have fallen to an average of $6,873/day in the last three months, compared with $16,873/day in the previous three-month period. And the picture gets even uglier for the large VLCC, where the  time charter equivalent earnings for operating  in the spot market have averaged only $3,788/day. 


In the light of still heavy supply coming up, the level of second hand prices should be somewhat surprising. TMN wants to blame a mix between creditors' interest to "extend and pretend" and central bank engineered liquidity for this phenomenon for now. Many market participants still think hard assets are the way to play. However, hard assets that earn negative carry for an extended period of time have only one way to go. 

                                             click on chart to enlarge

SPX - Shooting Star likely to end "quantitative squeezing"

SPX produced a shooting star on the daily candlestick charts. This in itself is not a confirmation that a sell off will start immediately but more often than not reversal patterns commence after a shooting star. TMN would not exclude a retest of the top before the SPX finally rolls over, in any case TMN wants to give the current candle stick set up the benefit of doubt that we are dealing with an important top. The market has been advancing in extraordinarily steep fashion within a very short period of time (150 pts in 7 weeks) and, let's face it, the upswing came basically on the idea of renewed money printing by the FED and nothing else. TMN thinks the US are not quite anywhere near Zimbabwe yet but of course, should the FEDs go for the nuclear option, it will end just like it. Anyway, a clearer signal in favour of a top at these levels would be visible should the SPX produce a few closes below the mid Bollinger Band (currently @ 1165.09). A hint that these closes below the mid BB lvl will materialize would be given if SPX 1171.5 got tagged any time within the next few days. TMN can't wait to watch the movie plot unfold...


                 click on chart to enlarge


Sunday 24 October 2010

DXY and GBP update

TMN has discussed the weekly chart on the USD a few times over the last week and is convinced that the current set up is, from a purely technical viewpoint, the strongest in years. The up thrust that will get released here soon might be of immense nature. Until now we had to be happy with baby steps, the next baby step would a few firm daily closes above the mid BB on the daily chart you will see below (currently @ 77.74). For confirmation that we are on the right path, TMN wants to see weekly closing lvls above the 61% Fib lvl 77.93 (2008 low vs 2009 high).

              click on chart to enlarge


The mix between austerity and green light for the BOE does not go down that well for GBP, as expectedGBP needs to put in a few daily closes below the support cluster around 1.5654 (50dma) and 1.5637 (50% fib between the 2009 high and the 2010 low) to confirm more downside to come. Although some indicators are looking close to oversold, TMN wants to stick with the short GBP recommendation for now and wait how next week plays out. 

            click on chart to enlarge

Tuesday 19 October 2010

DXY weekly trigger hit - more upside to come

As suspected by TMN the USD Index hit and exceeded last week's high today. Technically a stronger bounce in the USD should be under way and dips should get bought. 


                       Please click on chart to enlarge


GBP has been trading on the weak side versus the USD for a few days now, TMN has been surprised it even took that long to get this one going. Tomorrow we will have details on spending cuts by the UK government. TMN is of the opinion that there is a good chance that they will come in on the tamer side, which should be bad for GBP fundamentally, however a short term bounce can not be excluded at this point. In any case GBP remains a sell on rallies.

                Please click on chart to enlarge

Boy (and girl) plungers keep watching this top building process


It looks like the topping process is coming to an end and the sell off, TMN is waiting for, will materialize soon.

As per TMN's previous post [boy (and girl) plungers, start your engines: equity market sell off imminent], the VIX 18 level has triggered rewarding sell offs in the past (1 and 2 on the chart) and this time, so far, looks no different. All that remains to be seen is a close above the middle BB and break out from the descending wedge.

                                  click on chart to enlarge


The NYSE advance-decline issues have been in an upward channel with the moves unfolding into 4 waves. Waves 1 and 3 marking upward moves while waves 2 and 4 marking corrections.


It seems the NYAD has finished its 3rd wave up and we have already entered into the corrective wave 4. TMN thinks that the chances of NYAD correcting back to the lower trend line are significant.

                             click on the chart to enlarge


The next few days are definitely going to be extremely interesting and TMN will be paying close attention to the NYAD and VIX charts for a confirmation that a sell off is underway.

Saturday 16 October 2010

DXY - counter trend bounce likely: Part II

Below a quick update on TMN's case for a counter trend bounce in the Dollar Index. TMN will not discuss all of the arguments made earlier this week in favour of this move again, as they have hardly changed, however there are a couple of new reasons to be (at least) short term bullish on the USD:


1) Benjie Boy's speech on Friday in Boston turned out to be rather cute.


2) The elections on November 2nd will likely reduce Bernanke's wardrobe to either a dress or a skirt. TMN thinks both do go well with a beard. Should Obama's Democrats suffer an election defeat, which TMN believes they will, the significance of the upcoming FED meeting will be limited to say the least. 


TMN does not think Bernanke will be stripped of his keyboard but the efficacy of some buttons might be reduced for at least as long as the president is not republican (except Ron Paul).


Despite the DXY dipping one more time since TMN's last comment on this topic, the technical set up has hardly changed. The inverted hammer that we had mid week on this chart turned into a massive doji. The top of this doji is at 77.93, which TMN regards as a trigger level for more upside once tagged. 
    
                 Click on the chart to enlarge

QE is not for free

As TMN has been highlighting throughout the week, a trend reversal in long end yields is under way. Ten year yields are embarking on a similar move. Weekly indicators are looking to work their way out of deeply oversold conditions and TMN will regard the move as confirmed upon TNX producing a weekly close above 28.27. This should at least lead to a follow through towards the 38% Fib. level at 32.90.

                  Please click on the chart to enlarge

Thursday 14 October 2010

Boy (and girl) plungers, start your engines: Equity Market Sell Off Imminent

On the VIX chart TMN has identified the level where the last 3 sell offs started from [labelled (1), (2) and (3)].


Going back to January 2010 [ number (1) on the chart] one can see that, after hoovering around the 18 level, VIX eventually broke out and the market sold off, giving back around 100pts. Next time around  late April 2010 once VIX traded higher than the 18 level [number (2) on the chart] the sell off commenced and was good for 200 pts.


Yesterday, VIX tested the 18 support level. After trading in a descending wedge for the last 3 months and a fake break down, it looks like VIX wants to resolve to the upside.


TMN will regard the move as confirmed as soon as VIX closes above the middle BB and and a break out from the descending wedge has been achieved.

        Please click on the chart to enlarge


The BKX has been on a declining path over the last week and is sitting right on its 50 day moving average.


Additionally, we have a daily close near the 50% fib. level between the July 2009 bottom and the April 2010 top. The RSI has turned down and is below 50. MACD is rolling over and momentum is close to failure and a  drop below zero.


Caution: as we are dealing with strong forces that have tried everything so far to avoid this move to unfold, TMN will use wide stops and allow until early next week for the move to materialize.

       Please click on the chart to enlarge

US Initial Claims

The weekly number is out again, beating expectations and still standing at high levels (462K).

Even though the number is way off the highs, what is interesting is the fact that initial claims are still standing at high levels compared to the past. The historic average for times of expansion and recession is standing at 364K and 369K respectively; hence a lot of work needs to be done for the current number to drop 100K and stabilize around or lower its historic average.


The economy came out of recession in June 2009 and the massive liquidity injection into the system does not seem to have the expected impact on people seeking unemployment insurance. It remains to be seen how the QE II will affect unemployment in the coming months.

Could this time be different? Or are we going to experience a similar situation of back to back recessions like in the early 1980s?

Click Chart to Enlarge

Wednesday 13 October 2010

DXY - counter trend bounce likely

The USD has surely been the world's favourite funding currency over the last 4 months, as it is yielding nothing. Positioning has changed massively during this period, by now hardly anyone outside the US wants to hold USD. If you ask TMN, having enough USD still buys anything on this planet which is why TMN refuses to see the USD as the single worthless paper currency of the world. The others are by no means any better or worse, momentum, short term policy decisions and yields are the factors that are driving these markets. It took the market a while to get on this USD down move which is probably why it unfolded in such a violent manner. However, TMN is seeing signs of a reversal here. For now it might be only a counter trend bounce but it could be one worth playing.


TMN's reasons are of various nature: 


1) USD longs have had a very hard time lately, there are probably not many left, slow moving real money has switched into all kinds of currencies simply for the better yield, short term players most likely have enough of getting their fingers burned on a daily basis.


2) Yields, especially the long end, have been rising over the last few days and look like they will keep doing so for a while (see the older posts below).


3) US Banks will come in raising USD denominated equity at an increasing rate again, as the FED will disclose 2007-10 emergency lending to banks in detail on December 1st. Be sure speculators and their creditors will not get bailed out one more time. Politicians love their own job too much to deal with an angry public. Besides, bond market pressures are likely to force them to narrow down the "too big to fail" group to the inner core (Long JPM/Short GS could be a good pair trade from here). 


4) The EUR failed again at 1.40 on several occasions today and TMN thinks given Mr Weber's comments the other day the EUR should be trading way above 1.40 if the USD sell off was meant to continue. 


5) QE2 has been priced in to nuclear extent. Let's not forget that the "others" are money printers too, as the BOE has reminded us over the last weekend (see GBP related post below). ECB tough talk does not stop them to lend against collateral of very debatable quality after all. If it blows up in their face it will get monetized in one go and all the tough talk goes straight down the toilet. Mr. Weber might just make it into the ECB hot seat before that...


6) The technical set up shown below on the weekly chart (as per today's close) is hard to ignore. Admittedly these set ups occasionally get blown away by strong trends when they appear on shorter time frames but on weekly charts they are somewhat harder to take out. 


                          click on chart to enlarge


Tuesday 12 October 2010

The long end has had enough? Part II

Bond markets had a day off yesterday and sold off upon return to normal business. Yields are on the rise, the long end was up by 1.28%. 

Technically important and throughout positive for the case made by TMN a few days ago are the following factors:

- RSI rose through the 50 level
- daily close @ 37.94 above the mid BB (37.61) and above the 50 dma (37.81)
- daily close above  the 50% fib lvl ( 37.92) between the 2008 bottom and the 2009 top
- MACD is heading up
- momentum went through the zero line

             click on the chart to enlarge


Monday 11 October 2010

Top Building and Move Back to 1070-1080.....

It looks like the market has already started the process of top building last week and a move back to 1070-1080 is in the cards.

Below is a chart of SPX with two indicators for volume and tick.

Starting with the volume indicator, red and green vertical lines represent sell and buy signals respectively.

Rewind to Sep'09-Jan'10 and we can notice how the volume indicator fluctuated in a range giving sell and buy signals (denoted as SS and BS) every time it was hitting the top and bottom of the range.

Fast forward to Jun'10-Oct'10 and we can see that the indicator is fluctuating again in a range with the top and bottom of the range giving sell and buy signals.

And here we are today, with the indicator giving another sell signal after giving the first one last week. Sure, it can break upwards like it did back in Mar'10, but for the time being we have to take the sell signal.

Add to that the fact that the tick indicator is exhibiting negative divergences for quite some time now and the move to 1070-1080 looks even more promising.

Is the volume indicator going to breakout or will it stay in the range and validate the recent sell signals? Stay tuned for  an update on the volume indicator tomorrow.

Click Chart to Enlarge

Sunday 10 October 2010

Probability of Recession and the TMN Model

Since The National Bureau of Economic Research (NBER) is extremely late in announcing peaks and troughs in the US Economy, TMN thinks it would be useful to have its own model in predicting recessions.


Possible reasons for the late declarations of peaks and troughs could vary and include many, but two possible ones are the following: 1) Political reasons, as the ruling party may benefit from delaying a declaration that a recession had started or accelerating a declaration that a recession had ended; 2) Conflict of interest between the committee members of NBER who decide the peaks and troughs.

TMN is using a simple approach as it believes that the more simple the approach the better chances exist for the model to be robust as economic data change and may get revised every month. For that reason the model employs only two variables that may get revised when new data arrive, and the methodology used is the logit binary choice model. Furthermore, the model is using monthly data and calculates the probability of the economy being in a recession in the current month by using the latest available data.

The model tries to capture changes in the following areas by using the appropriate variables/indexes according to TMN's judgement: 1) Shipping Market Conditions, i.e. demand and supply for seaborne transportation of goods; 2) Stock Market Conditions; 3) Credit Market Conditions; 4) Employment Conditions and 5) and Manufacturing Conditions (note that the only variables subject to revisions are in 4 and 5). 

In the attempt to decide the cut-off probability value that will define the start and end of a recession, TMN uses the optimal cut-off probability as described by Palepu (1986). The cut-off probability - of the model - that defines when a recession has started or ended is 26%; i.e. probabilities that are higher (lower) than 26% declare that the economy is in a recession (expansion) the current month.  The results of the model can be found below, where the estimated probability of recession is plotted against the SP500 and the recessions as defined by NBER

The current probability that the US Economy was in recession during September 2010 is now standing at very low levels, 0.40%. It is now interesting to look at how far ahead the TMN model identifies peaks and troughs in respect to the NBER's declaration dates and actual peaks and troughs. 


As it can be noted from the table above, the TMN model signals peaks and troughs well ahead of the NBER. Looking at actual dates of peaks and troughs the TMN does not perform bad either. During the 1990s recession, the TMN model was late one month in identifying both the start and end of recession. In the case of the early 2000 recession, the TMN model identified the start of recession 4 months ahead of the actual date. On the other hand, there was a lag of 2 months behind in identifying the end of recession. Finally, the TMN model did not perform bad for the recent recession either. It recognised the start of recession 3 months after the actual date and it coincided exactly on the same month as the actual date for the end of the recession.

Overall, TMN believes that the model is very useful in identifying the overall economic situation in the US and certainly faster than NBER's declaration dates of peaks and troughs. Finally, two good indicators for the business climate in the US are the Aruoba-Diebold-Scotti Conditions Index provided by the Federal Reserve Bank of Philadelphia, and the Russell Investments Business Cycle Index.

Saturday 9 October 2010

The long end has had enough?

Print baby, print until the bond markets stops you! Yields have a long way to go to test the pain threshold.
Bon voyage!


Cameron has had a pretty easy life so far

http://www.ft.com/cms/s/0/3badb38c-d313-11df-9ae9-00144feabdc0.html
The FT informs us that the chancellor backs more pumping by the BOE. Not surprising given the weakest UK housing reading last week since records began. Austerity talk has been rewarding David Cameron for a while and currency markets were busy giving the USD a beating pretty much since the coalition government took office but TMN thinks this is about to change.

Rowing Backwards?

Jimmy Bullard was on air on CNBC yesterday telling us that the US economy is probably not doing that bad and there might be no need for additional QE in November, maybe it could be December instead or maybe the economy is just doing ok enough to scrap it altogether. His paper that was out a few months ago http://research.stlouisfed.org/econ/bullard/pdf/SevenFacesFinalJul28.pdf has been the fuel to one of the most bizarre rallies in various asset classes that The Macro Navigator has ever witnessed.

Only a few hours later the reading on non farm payrolls in the US was bad enough to spark another QE2 fuelled intraday rally that left The Macro Navigator scratching its head. http://www.telegraph.co.uk/finance/economics/8051918/US-job-losses-drive-markets-higher-on-stimulus-hopes.html  

TMN thinks that absurdity has reached extreme levels now, extremes that remind TMN strongly of 2008 where the fireworks did not stop until there was no oxygen left. 

TMN saw Jimmy Bullard speak in 2008 in the UK where he was trying to make believe that "too big to fail" is nothing that will persist but it should rather be interpreted as "too big to fail right now". Not that TMN would ever believe any of these tales, especially when FED sponsored deals allow the "too big to fail" banks get ever larger and larger. TMN were polite enough to not throw him a shoe when the opportunity was there. On the other hand the FED's own medicine, an ever expanding FED balance sheet, will likely help in taking baby steps towards the FED's own funeral. We maybe should be thankful for that.


The big picure has been an ugly one for 10 years


Let's not kid ourselves, this is the big picture and it ain't pretty! Innovation has taken the market to the top but if we do not run into the next "big thing" that could give fuel to a new bull market the decline will just keep going. Financial history tells us that printing money is no solution, and this chart confirms it regarding the past decade. 


The bull market in commodities has been a PR myth, in real terms there has been a decline that is still ongoing.