Tuesday, 12 October 2010

The long end has had enough? Part II

Bond markets had a day off yesterday and sold off upon return to normal business. Yields are on the rise, the long end was up by 1.28%. 

Technically important and throughout positive for the case made by TMN a few days ago are the following factors:

- RSI rose through the 50 level
- daily close @ 37.94 above the mid BB (37.61) and above the 50 dma (37.81)
- daily close above  the 50% fib lvl ( 37.92) between the 2008 bottom and the 2009 top
- MACD is heading up
- momentum went through the zero line

             click on the chart to enlarge


Monday, 11 October 2010

Top Building and Move Back to 1070-1080.....

It looks like the market has already started the process of top building last week and a move back to 1070-1080 is in the cards.

Below is a chart of SPX with two indicators for volume and tick.

Starting with the volume indicator, red and green vertical lines represent sell and buy signals respectively.

Rewind to Sep'09-Jan'10 and we can notice how the volume indicator fluctuated in a range giving sell and buy signals (denoted as SS and BS) every time it was hitting the top and bottom of the range.

Fast forward to Jun'10-Oct'10 and we can see that the indicator is fluctuating again in a range with the top and bottom of the range giving sell and buy signals.

And here we are today, with the indicator giving another sell signal after giving the first one last week. Sure, it can break upwards like it did back in Mar'10, but for the time being we have to take the sell signal.

Add to that the fact that the tick indicator is exhibiting negative divergences for quite some time now and the move to 1070-1080 looks even more promising.

Is the volume indicator going to breakout or will it stay in the range and validate the recent sell signals? Stay tuned for  an update on the volume indicator tomorrow.

Click Chart to Enlarge

Sunday, 10 October 2010

Probability of Recession and the TMN Model

Since The National Bureau of Economic Research (NBER) is extremely late in announcing peaks and troughs in the US Economy, TMN thinks it would be useful to have its own model in predicting recessions.


Possible reasons for the late declarations of peaks and troughs could vary and include many, but two possible ones are the following: 1) Political reasons, as the ruling party may benefit from delaying a declaration that a recession had started or accelerating a declaration that a recession had ended; 2) Conflict of interest between the committee members of NBER who decide the peaks and troughs.

TMN is using a simple approach as it believes that the more simple the approach the better chances exist for the model to be robust as economic data change and may get revised every month. For that reason the model employs only two variables that may get revised when new data arrive, and the methodology used is the logit binary choice model. Furthermore, the model is using monthly data and calculates the probability of the economy being in a recession in the current month by using the latest available data.

The model tries to capture changes in the following areas by using the appropriate variables/indexes according to TMN's judgement: 1) Shipping Market Conditions, i.e. demand and supply for seaborne transportation of goods; 2) Stock Market Conditions; 3) Credit Market Conditions; 4) Employment Conditions and 5) and Manufacturing Conditions (note that the only variables subject to revisions are in 4 and 5). 

In the attempt to decide the cut-off probability value that will define the start and end of a recession, TMN uses the optimal cut-off probability as described by Palepu (1986). The cut-off probability - of the model - that defines when a recession has started or ended is 26%; i.e. probabilities that are higher (lower) than 26% declare that the economy is in a recession (expansion) the current month.  The results of the model can be found below, where the estimated probability of recession is plotted against the SP500 and the recessions as defined by NBER. 

The current probability that the US Economy was in recession during September 2010 is now standing at very low levels, 0.40%. It is now interesting to look at how far ahead the TMN model identifies peaks and troughs in respect to the NBER's declaration dates and actual peaks and troughs. 


As it can be noted from the table above, the TMN model signals peaks and troughs well ahead of the NBER. Looking at actual dates of peaks and troughs the TMN does not perform bad either. During the 1990s recession, the TMN model was late one month in identifying both the start and end of recession. In the case of the early 2000 recession, the TMN model identified the start of recession 4 months ahead of the actual date. On the other hand, there was a lag of 2 months behind in identifying the end of recession. Finally, the TMN model did not perform bad for the recent recession either. It recognised the start of recession 3 months after the actual date and it coincided exactly on the same month as the actual date for the end of the recession.

Overall, TMN believes that the model is very useful in identifying the overall economic situation in the US and certainly faster than NBER's declaration dates of peaks and troughs. Finally, two good indicators for the business climate in the US are the Aruoba-Diebold-Scotti Conditions Index provided by the Federal Reserve Bank of Philadelphia, and the Russell Investments Business Cycle Index.

Saturday, 9 October 2010

The long end has had enough?

Print baby, print until the bond markets stops you! Yields have a long way to go to test the pain threshold.
Bon voyage!


Cameron has had a pretty easy life so far

http://www.ft.com/cms/s/0/3badb38c-d313-11df-9ae9-00144feabdc0.html
The FT informs us that the chancellor backs more pumping by the BOE. Not surprising given the weakest UK housing reading last week since records began. Austerity talk has been rewarding David Cameron for a while and currency markets were busy giving the USD a beating pretty much since the coalition government took office but TMN thinks this is about to change.

Rowing Backwards?

Jimmy Bullard was on air on CNBC yesterday telling us that the US economy is probably not doing that bad and there might be no need for additional QE in November, maybe it could be December instead or maybe the economy is just doing ok enough to scrap it altogether. His paper that was out a few months ago http://research.stlouisfed.org/econ/bullard/pdf/SevenFacesFinalJul28.pdf has been the fuel to one of the most bizarre rallies in various asset classes that The Macro Navigator has ever witnessed.

Only a few hours later the reading on non farm payrolls in the US was bad enough to spark another QE2 fuelled intraday rally that left The Macro Navigator scratching its head. http://www.telegraph.co.uk/finance/economics/8051918/US-job-losses-drive-markets-higher-on-stimulus-hopes.html  

TMN thinks that absurdity has reached extreme levels now, extremes that remind TMN strongly of 2008 where the fireworks did not stop until there was no oxygen left. 

TMN saw Jimmy Bullard speak in 2008 in the UK where he was trying to make believe that "too big to fail" is nothing that will persist but it should rather be interpreted as "too big to fail right now". Not that TMN would ever believe any of these tales, especially when FED sponsored deals allow the "too big to fail" banks get ever larger and larger. TMN were polite enough to not throw him a shoe when the opportunity was there. On the other hand the FED's own medicine, an ever expanding FED balance sheet, will likely help in taking baby steps towards the FED's own funeral. We maybe should be thankful for that.


The big picure has been an ugly one for 10 years


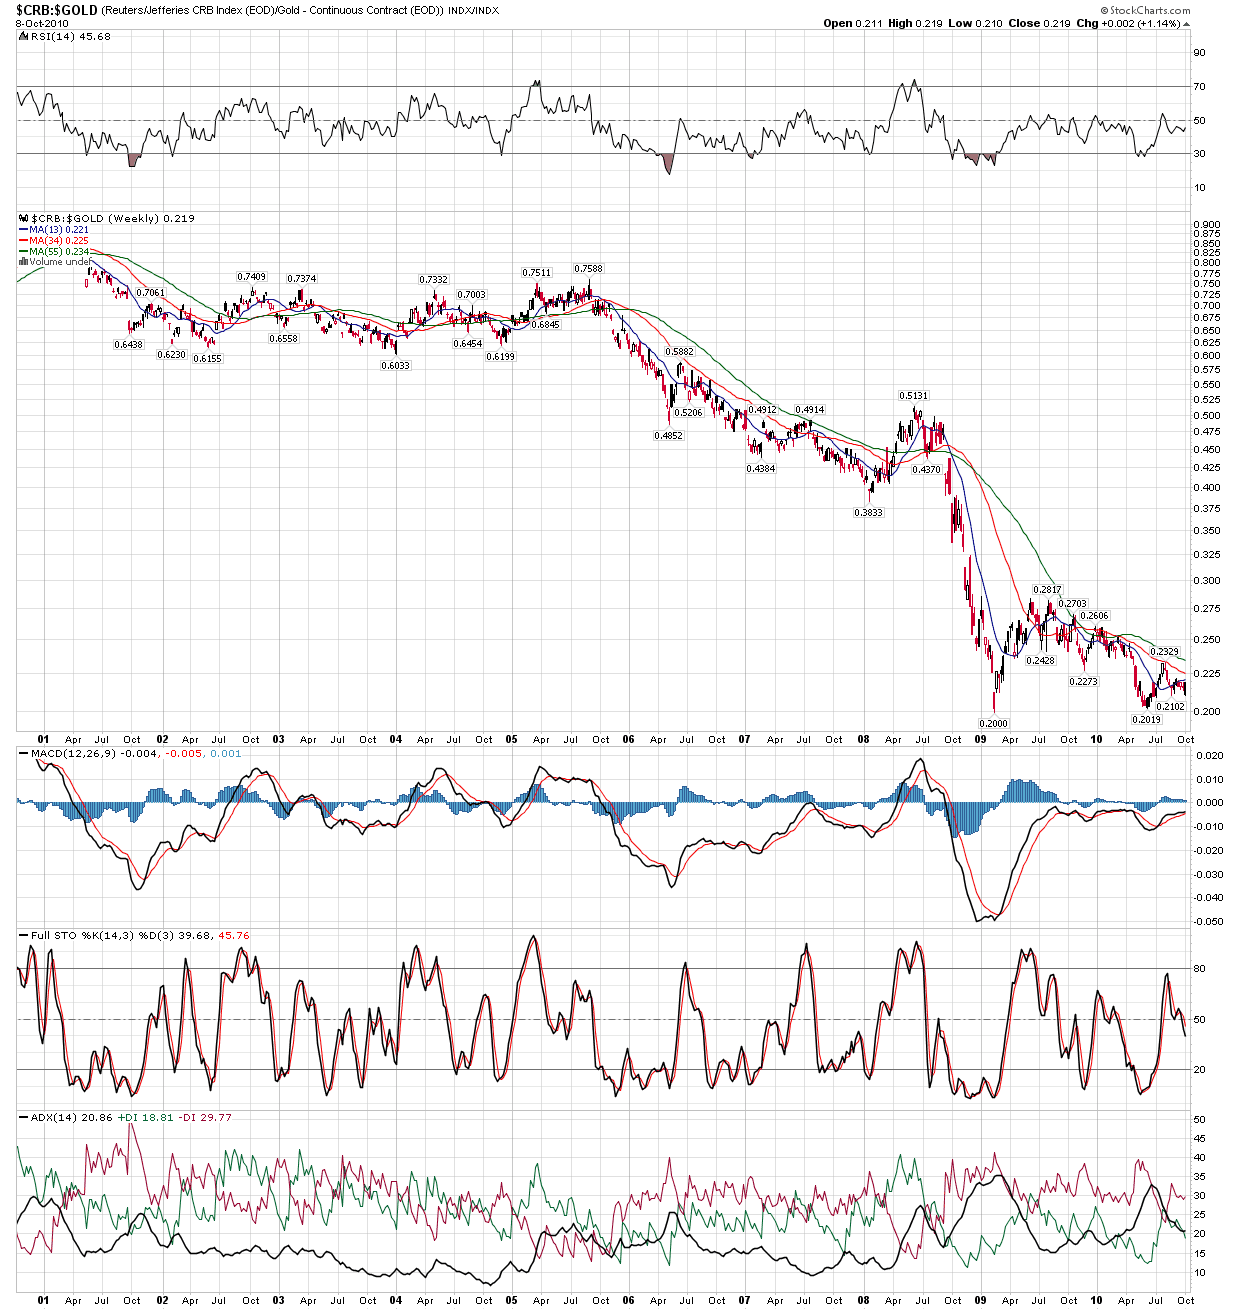
Let's not kid ourselves, this is the big picture and it ain't pretty! Innovation has taken the market to the top but if we do not run into the next "big thing" that could give fuel to a new bull market the decline will just keep going. Financial history tells us that printing money is no solution, and this chart confirms it regarding the past decade. 


The bull market in commodities has been a PR myth, in real terms there has been a decline that is still ongoing.